
ANALYTICS
Event Marketing Metrics: What to Measure Before, During, and After an Event
Choose event marketing metrics that connect audience reach, participation, follow-up, and business objectives, with clear definitions, data sources, and limits on what the numbers can prove.

Start event measurement with the decision the team needs to make. Registration volume helps evaluate reach, attendance rate reveals friction between signup and participation, and questions, polls or survey responses show what people did or said. Pipeline and revenue require additional systems, rules and evidence.
This guide is written for B2B digital events, virtual sessions and webinar-led campaigns. In-person and hybrid teams can adapt the same logic with additional systems for check-in, sessions, meetings, sponsors, ticketing or venue operations. The core rule holds everywhere: decide what should change before choosing what to count. A dashboard can describe activity without proving effectiveness, so the measurement plan has to connect the objective, audience, metric definition, data source, owner, time window and next decision.
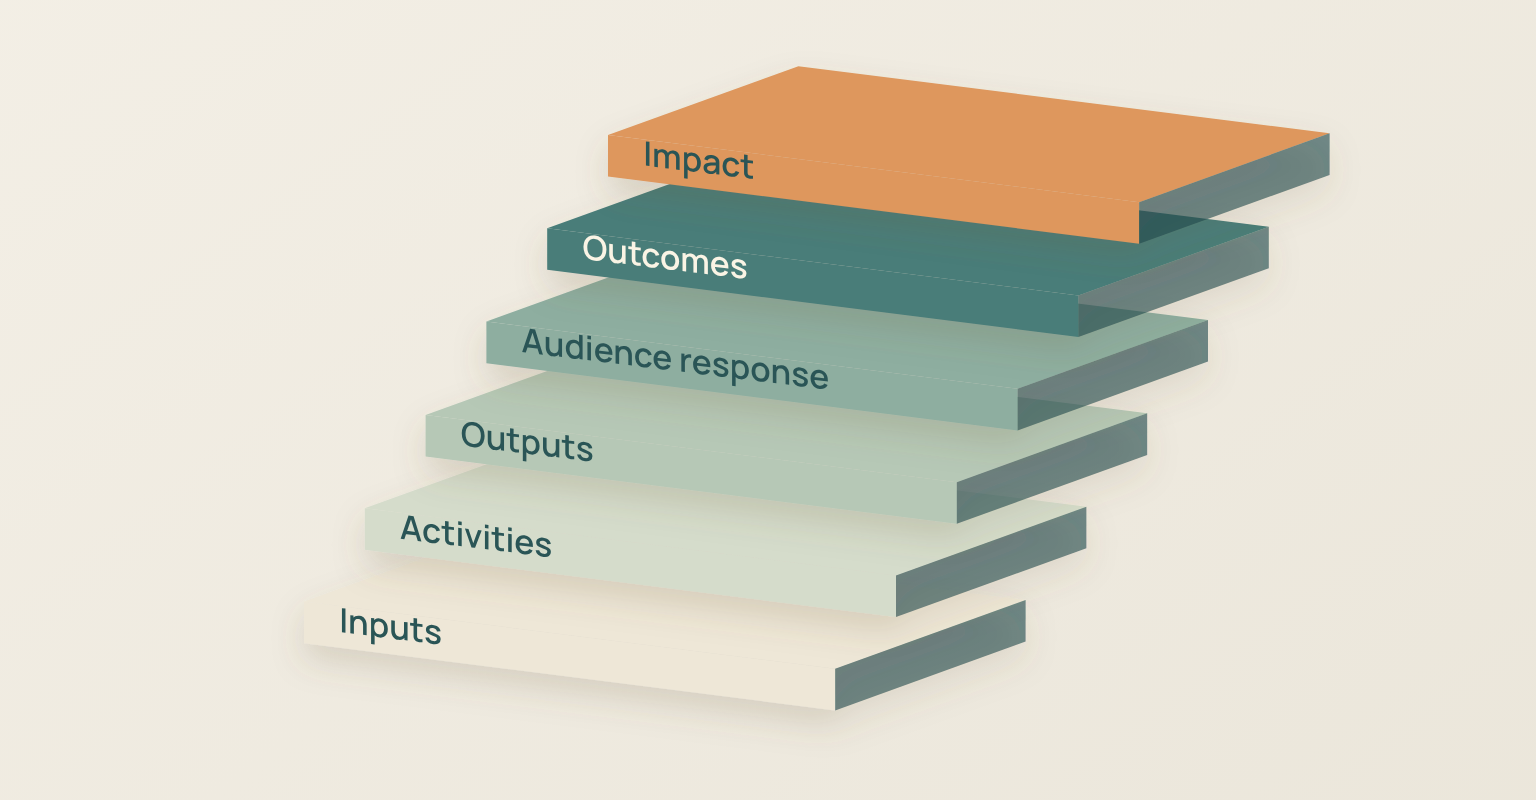
Event Marketing Metrics at a Glance
| Measurement Layer | Primary Question | Example Metrics | What It Can Support |
|---|---|---|---|
| Inputs | What did the event require? | Budget, staff time, production hours, paid media spend | Cost control, resourcing, forecasting |
| Activities | What did the team do? | Pages published, invitations sent, promotion assets, rehearsals | Execution tracking, operational accountability |
| Outputs | What immediate result was produced? | Page visits, registrations, attendees, replay views | Volume, delivery, audience flow |
| Audience Response | What did people notice, understand, or do? | Questions, poll participation, survey learning, resource clicks | Experience design, content relevance, follow-up |
| Outcomes | What changed after the event? | Meetings, trials, task completion, adoption, sales-accepted handoffs | Campaign effectiveness, progression, customer education |
| Impact | How did the event contribute to the organization? | Attributable profit, revenue, retention, opportunity progression | Investment decisions, strategy, long-term optimization |
AMEC's Integrated Evaluation Framework separates outputs, audience responses, outcomes and impact. That distinction stops a team from treating a large attendance count as proof of understanding, behaviour change or revenue. The layers connect, but they are not interchangeable.
Start with the Decision the Team Needs to Make
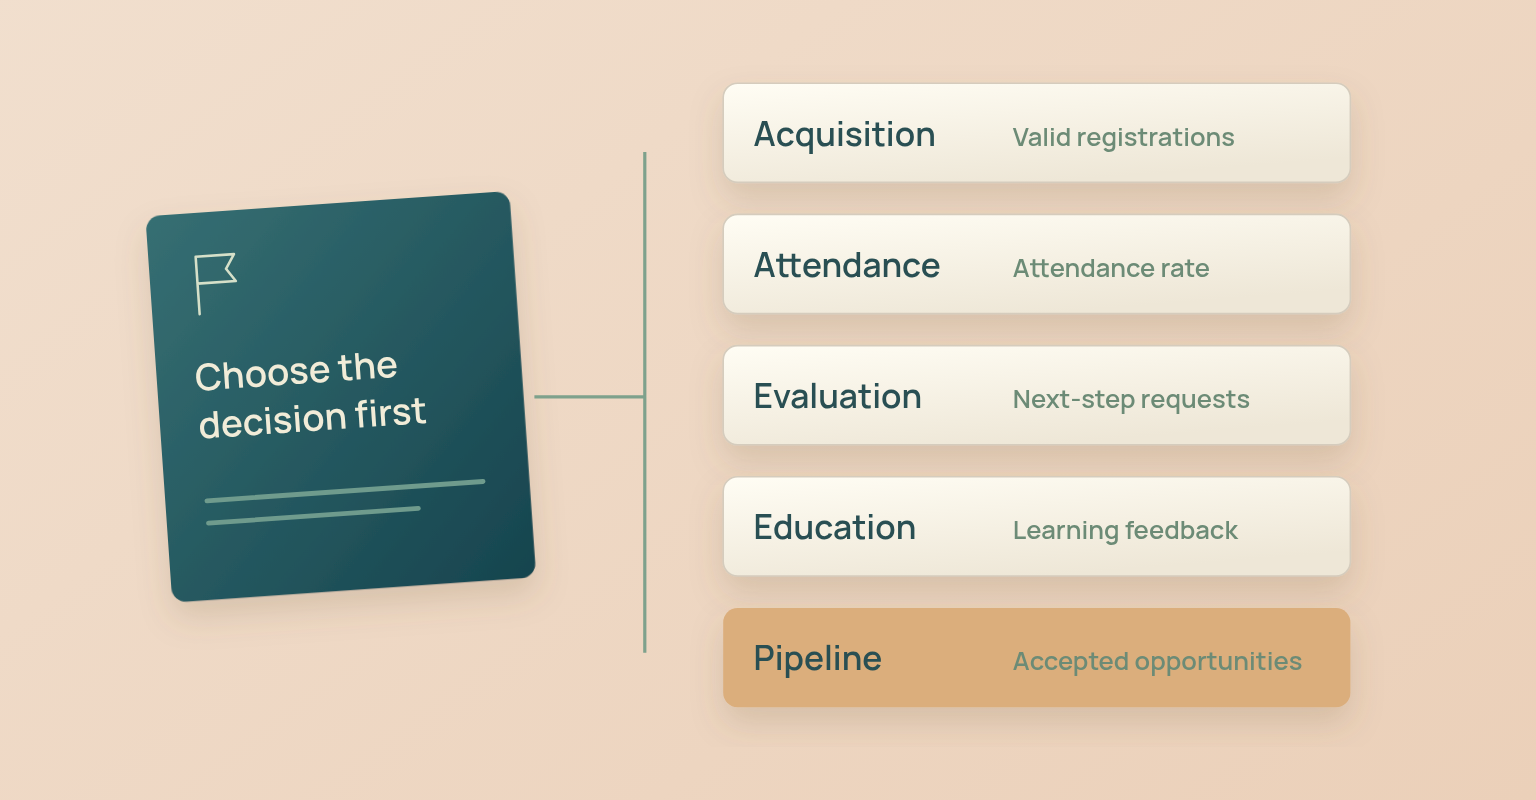
"Measure event success" is too vague. Decide whether the team needs to choose a promotion source, improve registration conversion, reduce no-shows, identify unresolved questions, support an opportunity, improve customer adoption, defend a budget or decide whether the format should run again.
| Event Objective | Primary KPI | Diagnostic Metrics | Decision Supported |
|---|---|---|---|
| Reach a new audience | Qualified registrations from new sources | Visits, source mix, registration conversion, audience fit | Continue, change, or stop a source |
| Improve attendance | Attendance rate by source and segment | Confirmation delivery, reminder clicks, time zone, access issues | Change message, timing, or access path |
| Support product evaluation | Relevant questions and agreed follow-up actions | Attendance, proof-moment participation, specialist requests | Route to product, sales, or nurture |
| Educate customers | Task completion or adoption outcome | Attendance, poll results, questions, resource use | Improve training, documentation, or follow-up |
| Create thought leadership | Understanding or consideration change | Qualified reach, session engagement, survey evidence, content use | Continue the narrative or change the point of view |
| Contribute to pipeline | Sales-accepted handoffs or opportunity progression | Account attendance, questions, follow-up, CRM status | Coordinate account action and future investment |
The event brief should name the audience, the intended change, the owner and the decision the report must support; the webinar planning checklist covers how to define that objective before selecting metrics.
Create a Metric Dictionary Before the Campaign Starts
A metric name is not a definition. "Engagement", "attendee", "conversion" and "influenced pipeline" mean different things across teams and tools. Create a shared dictionary before data begins arriving, stating the numerator, denominator, inclusion rules, exclusions, source system, owner, reporting window and known limitation.
| Field | Example | Why It Matters |
|---|---|---|
| Metric name | Attendance rate | Gives the measure a stable label |
| Business question | Did registrants participate live? | Connects the number to a decision |
| Formula | Unique live attendees / valid registrants x 100 | Prevents silent denominator changes |
| Inclusions | People with a valid registration who joined live | Defines who counts |
| Exclusions | Test accounts, staff, duplicates, cancelled registrations | Reduces inflation |
| System of record | Event platform | Identifies the authoritative source |
| Owner | Marketing operations | Assigns maintenance and interpretation |
| Time window | Live session only | Separates live from replay |
| Limit | Does not show attention or business outcome | Prevents overclaiming |
Definition rule: never compare two rates until the numerator, denominator, inclusion rules and time window are aligned. Two dashboards can display the same metric name and still measure different populations.

Measure Acquisition and Registration Quality
Acquisition metrics explain how the audience arrived and whether the registration promise converted the intended people. Segment them by source, medium, campaign, content, partner and meaningful audience attributes where the data is accurate and appropriate.
Google Analytics supports manual campaign dimensions such as source, medium, campaign, term and content through UTM parameters. Create the naming convention before distribution so partners, speakers, email, paid campaigns and social assets do not generate incompatible labels, then preserve the source values through the registration and event reports. The promotion plan includes a naming template.
Registration Conversion Rate
Formula: Registration conversion rate = Valid completed registrations / Eligible registration-page sessions x 100
Define the denominator carefully. Ad impressions, email recipients, landing-page sessions and unique visitors describe different stages. For page conversion, use the page traffic definition chosen by the analytics team. For email or paid-media performance, report the upstream measures separately rather than mixing them into one denominator. Compare the rate by source, device, audience segment and campaign type only when the sample is large enough to support a conclusion. The landing page guide covers page-level decisions.
Cost per Registration and Cost per Qualified Registration
Formula: Cost per registration = Directly allocated acquisition spend / Valid registrations attributed to that spend
A cheap registration is not automatically valuable. Add a quality view that reflects the event objective, such as target-account coverage, relevant role, attendance or a defined follow-up action, and keep the quality rule transparent. Do not hide subjective weighting inside a score the team cannot explain.
Measure Attendance and Access Friction
Attendance Rate
Formula: Attendance rate = Unique live attendees / Valid registrants x 100
Separate live attendance from replay viewing. A person who watches later may still receive value, but the behaviour answers a different question. Compare attendance by source, audience segment, event type and reminder path. A source that produces fewer registrations but a higher attendance rate may be more useful than a high-volume source with weak participation.
No-Show Rate
Formula: No-show rate = Valid registrants who did not attend live / Valid registrants x 100
No-show rate is a diagnostic measure for topic-message fit, timing, time zone, calendar behaviour, reminder design, access friction, competing priorities and whether the replay is the intended consumption path. Use it to improve the attendance journey, not to pressure recipients. The email templates give confirmation, reminders, live access, attendee follow-up and no-show follow-up distinct jobs and measurable next actions.
Measure Participation without Inventing an Engagement Score
Participation data helps explain the experience only when the interaction is defined. A question, a poll response, a resource click, a chat contribution, a meeting request and a replay view are different behaviours. Combining them with arbitrary weights produces a number that looks precise but cannot guide a decision.
| Interaction | Useful Definition | Possible Decision | Main Limitation |
|---|---|---|---|
| Question participation | Unique attendees who submitted at least one substantive question / live attendees | Improve agenda, Q&A, specialist follow-up | Silence does not prove disinterest |
| Poll participation | Unique valid respondents / attendees present when poll was available | Clarify understanding or audience context | Voluntary poll is not representative research |
| Resource action | Unique people who clicked or requested the promised resource / relevant recipients | Improve offer and follow-up | Click does not prove use or business value |
| Replay use | Unique verified replay viewers / eligible recipients | Improve chapters, access, or content reuse | A view does not prove attention or intent |
| Return attendance | People attending another relevant event within a defined period | Evaluate program value and audience continuity | Requires stable identity and comparable events |
The host, moderator, producer and campaign owner should know which evidence is being collected and who owns unanswered questions; the hosting guide covers those roles.
Use Surveys to Measure What Behavior Data Cannot Explain
Platform data can show that a person attended or answered a poll. It cannot reliably show what they understood, whether confidence changed or why they chose a next action. A short survey can help, provided the result carries a denominator, question wording, timing and sample context.
AAPOR notes that response-rate formulas are standardised, but response rate alone does not determine survey quality or nonresponse bias. For event feedback, report how many people were invited, how many responded, the response rate, when the survey was sent, and relevant differences between respondents and the full audience when those can be evaluated.
| Survey Use | Example Question | Report with the Result |
|---|---|---|
| Understanding | How confident are you that you can apply the framework? | Scale, wording, number invited, respondents, response rate |
| Relevance | Which part was most relevant to your work? | Options, open-text rules, audience segment |
| Next action | What will you do next? | Response options, timeframe, later behavioral check |
| Experience quality | Was the pace appropriate? | Scale labels, accessibility context, response count |
| Open feedback | What remained unclear? | Coding method, themes, sample quotes, privacy review |
Survey boundary: a post-event survey describes the people who responded. Do not present voluntary responses as a representative market study unless the research design supports that claim. The post-webinar survey template covers question design.

Measure Follow-Up and Business Outcomes
The event report should lead to an owned next decision. Attendees, no-shows, customers, active opportunities, product questioners and general learners may need different follow-up. Measure the action intended for each group rather than forcing every person into the same funnel stage.
| Outcome | Formula or Definition | System of Record | Decision |
|---|---|---|---|
| Follow-up action rate | People completing the defined next action / relevant recipients | Email, web analytics, CRM, product | Improve message, resource, or CTA |
| Sales-accepted handoff rate | Handoffs accepted under the agreed rule / handoffs submitted | CRM or revenue operations | Improve qualification and context |
| Meeting progression | Relevant meetings completed after the event / eligible handoffs | CRM and calendar process | Assess account follow-up |
| Opportunity association | Opportunities meeting the documented association rule | CRM | Report influence with stated logic |
| Customer task completion | Customers completing the intended task or adoption step | Product, success, training system | Improve education and onboarding |
| Content continuation | Use of replay, article, clip, or resource by the intended audience | Web, email, content analytics | Improve repurposing and distribution |
For product-led sessions, the demo script template defines proof moments so the team can measure whether the intended evidence, questions and next decision were produced. When the recording becomes follow-up content, the repurposing workflow gives each asset its own job and metric; a replay, a search article, a clip, a customer resource and a sales asset should not share one undifferentiated success measure.
Separate Event ROI from Pipeline Influence
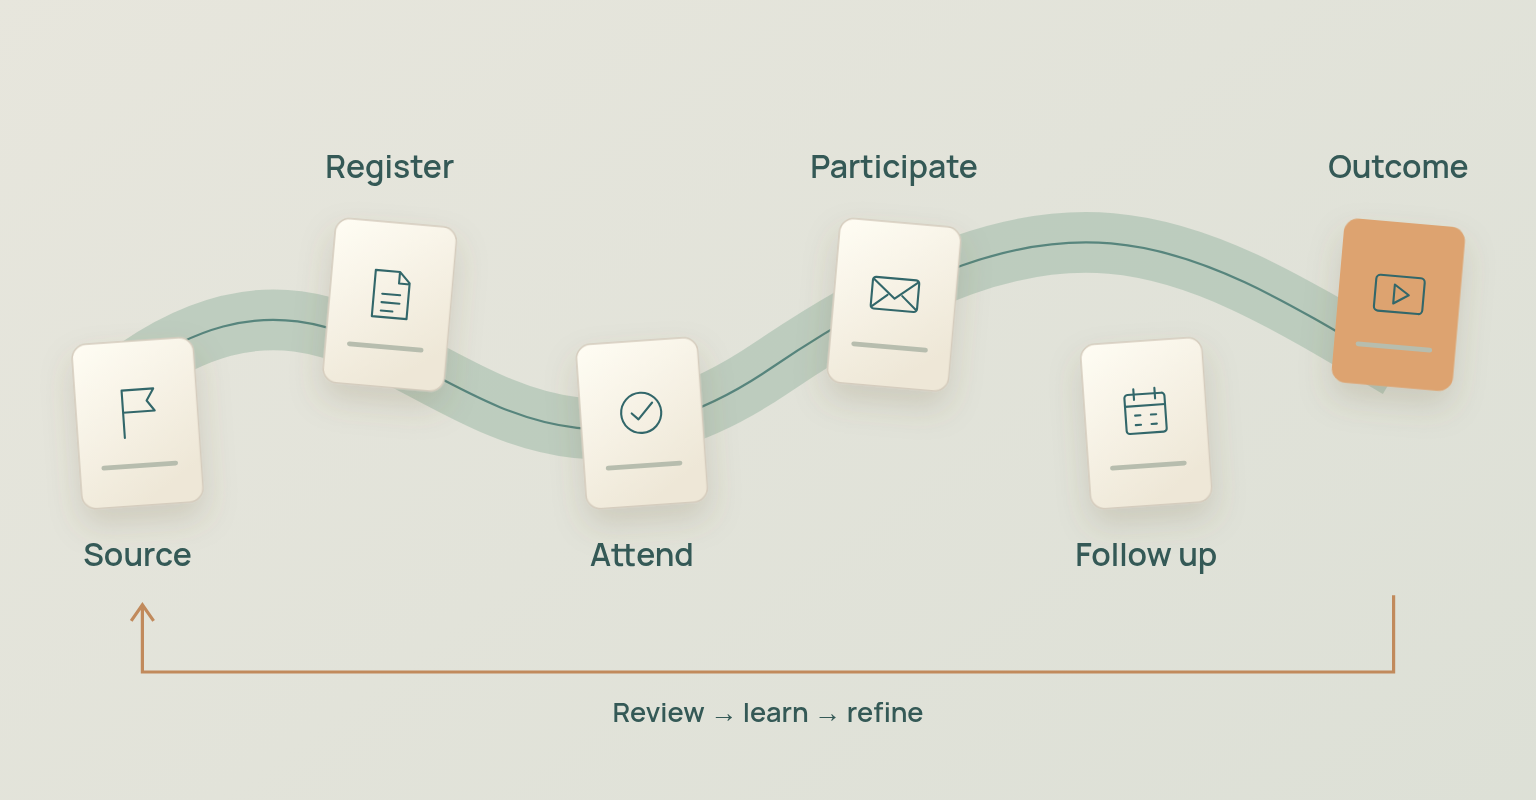
ROI is a financial measure, not a synonym for value. The Marketing Accountability Standards Board defines ROI as net profit divided by investment, multiplied by 100, and warns against attributing financial return without evidence that the marketing activity caused it and supported a stated objective. For events, the organisation must define which profit is attributable, which costs are included and what time window applies.
ROI formula: Event ROI = Net profit attributable to the event / Total event investment x 100
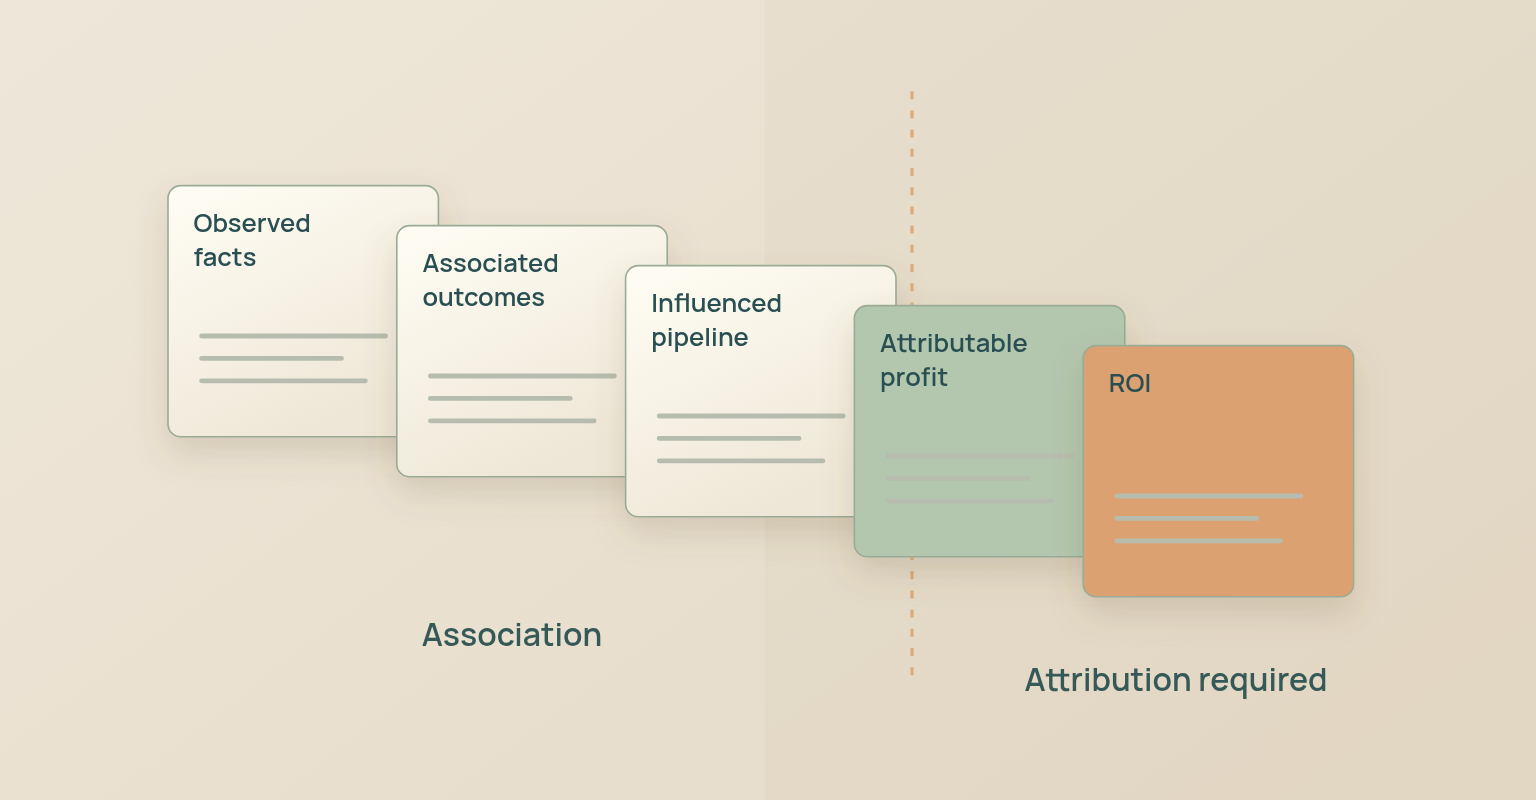
Use the formula only when attributable profit and total investment are defensible. Registration value, pipeline influenced, opportunities touched, meetings, content use and attendee engagement may be useful leading or diagnostic measures, but they are not net profit.
| Term | What It Means | Safe Reporting Language | Do Not Claim |
|---|---|---|---|
| Event-sourced | The documented first meaningful campaign source meets the agreed rule | X opportunities were event-sourced under the stated rule | The event caused all later revenue |
| Event-influenced | The event was one documented touch in a defined window | X pipeline included an event touch | The full pipeline value is event ROI |
| Event-associated | A contact or account attended during an active opportunity | X opportunities had associated attendees | Attendance changed the opportunity |
| Attributable profit | A validated method estimates profit caused by the event | ROI under the documented model was X | Revenue equals profit or correlation equals causation |
Cvent's 2026 Event-Led Growth report, based on more than 1,000 marketers in the United States and United Kingdom, reports increasing pressure to connect events to pipeline and revenue. Treat vendor research as directional context, not as proof that every organisation can make the same attribution claim.
Compare Sources by Quality, Not Only Volume
Evaluate a source across the full audience path. One partner may create many registrations and few attendees. Another may create fewer registrations but stronger attendance, relevant questions and useful follow-up. Report the sequence rather than selecting the most flattering number.
| Source | Registrations | Registration Conversion | Attendance Rate | Relevant Actions | Interpretation |
|---|---|---|---|---|---|
| Owned email | High | Medium | Medium | Medium | Large known audience; improve targeting and reminders |
| Partner | Medium | High | High | High | Strong trust and fit; preserve partner context |
| Paid social | High | Low | Low | Low | Reach may be broad; review promise, targeting, and spend |
| Speaker network | Low | High | High | Medium | Small but relevant audience; continue with better enablement |
| Organic search | Low | Medium | Medium | Medium | Longer-lived discovery; connect article and event intent |
The table is an example structure, not benchmark data. Replace every qualitative label with your own documented numbers and sample sizes.
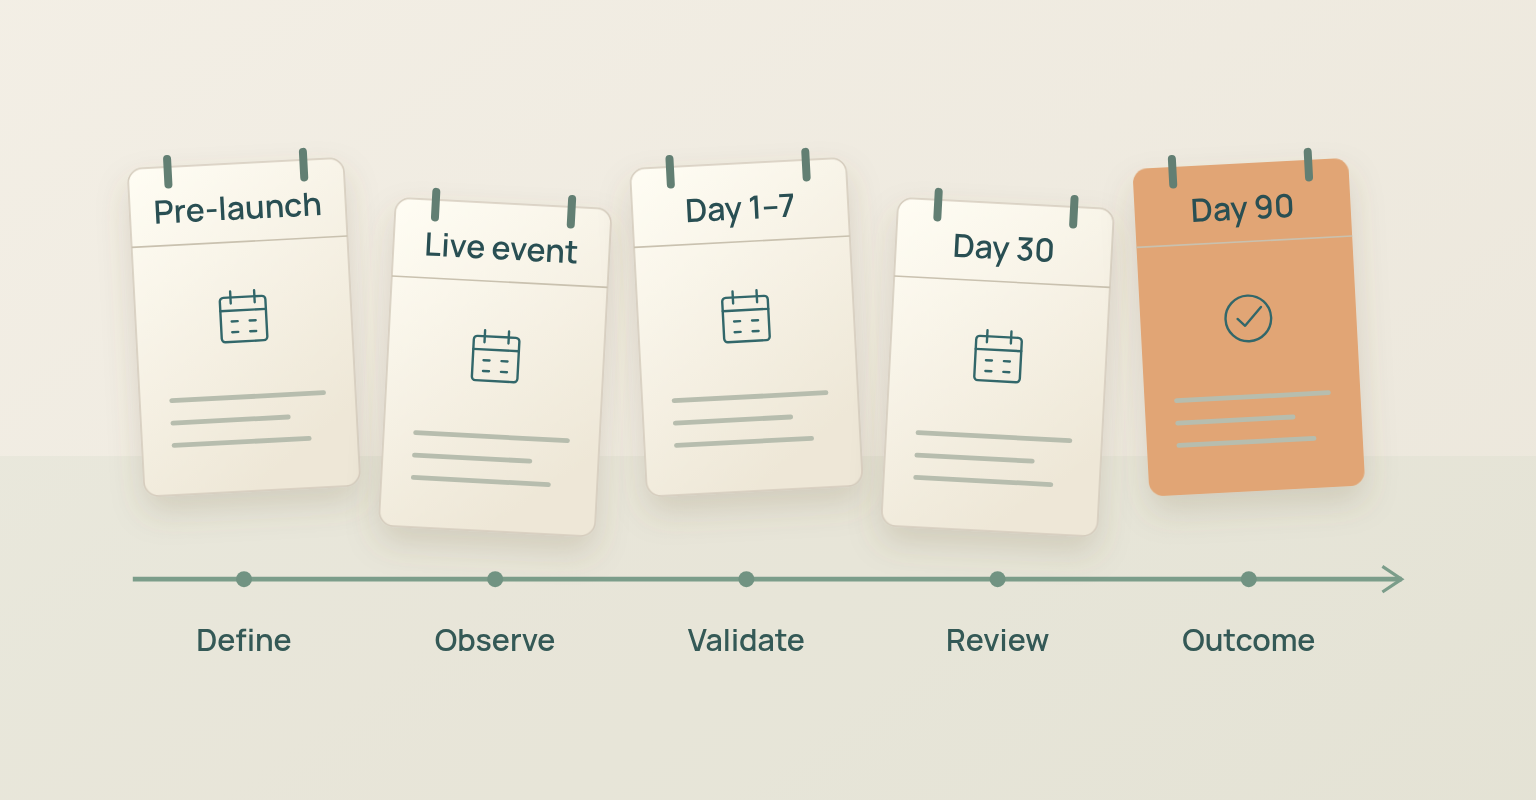
Use a Reporting Cadence That Supports Decisions
| Timing | What to Review | Primary Decision Owner | Decision |
|---|---|---|---|
| Before launch | Objective, audience, baseline, definitions, source naming, costs | Campaign owner and analytics | Approve the measurement plan |
| During promotion | Visits, registrations, conversion, source quality, delivery issues | Demand generation or event marketing | Change message, source, spend, or page |
| Before live | Registration mix, attendance readiness, access issues, reminders | Campaign owner and producer | Protect attendance and experience |
| Immediately after | Attendance, no-shows, questions, polls, incidents, promises | Campaign, content, and product owners | Route follow-up and verify evidence |
| Within 7 days | Replay, resources, survey, handoffs, meetings, unresolved questions | Marketing operations and relationship owners | Continue, nurture, or stop |
| Within 30-90 days | Opportunity progression, customer outcome, content performance, attributable value | Marketing, revenue, finance, customer teams | Invest, redesign, repeat, or retire |
Copyable Event Measurement Brief
1. Objective. By [time], [audience] will [desired change], measured by [primary KPI], in support of [business objective].
2. Decision. The report must help [owner] decide whether to [continue, change, expand, stop, route or invest].
3. Primary KPI. Metric name: [Name]. Definition and formula: [Definition]. Baseline: [Value or unavailable]. Target: [Value or learning threshold]. Time window: [Window].
4. Diagnostics. Sources: [Source dimensions]. Audience segments: [Segments]. Experience measures: [Measures]. Known limitations: [Limitations].
5. Systems and owners. Event platform: [Owner]. Web analytics: [Owner]. Email or automation: [Owner]. CRM or revenue: [Owner]. Finance or cost data: [Owner].
6. Review cadence. Live monitoring: [Frequency]. Post-event review: [Timing]. Business outcome review: [Window]. Final decision and owner: [Decision].
Common Event Measurement Mistakes
- Choosing KPIs after the event. The team collects whatever the platform exposes and then searches for a success story. Define the objective, metric, source and decision before launch.
- Reporting registrations as business impact. Registrations are an output. They do not prove understanding, qualification, opportunity progression or revenue.
- Changing the denominator. A rate becomes incomparable when one report uses sessions, another unique visitors and a third email recipients.
- Using an unexplained engagement score. A combined score hides incompatible actions and arbitrary weights. Report the behaviours separately unless the score has a documented, validated purpose.
- Treating survey respondents as the whole audience. Voluntary respondents may differ from nonrespondents. Report sample and response context before generalising.
- Calling pipeline ROI. Pipeline is not net profit. Report influence or association using the documented rule and reserve ROI for defensible financial attribution.
- Ignoring source quality. The source with the most registrations may not produce the best attendance, questions, follow-up or business outcome.
- Leaving the report without a decision. A dashboard nobody owns does not improve the next event. Every review ends with a named action, owner and timing.
How JakoMeet Supports Event Measurement
JakoMeet provides the factual webinar record inside the event workflow. Organisers can review registrants, attendees, no-shows, attendance rate, supported registration sources, questions, poll results and replay data before adding interpretation or business context. On Growth, they can also review transcript, Q&A and poll themes under human control as a separate interpretation layer.
JakoMeet does not replace web analytics, campaign spend records, CRM opportunity data, finance systems or a documented attribution model, and it does not turn every attendance or engagement signal into qualification, pipeline or ROI. For demand programmes, connect event evidence to a broader lead-generation campaign; for the wider sequence, see how the full event workflow connects in JakoMeet or compare the plans.
Frequently asked questions
What Are Event Marketing Metrics?
Event marketing metrics are defined measures used to evaluate how an event performed against a specific objective. They can describe inputs such as cost, outputs such as registrations and attendance, audience responses such as participation or learning, outcomes such as follow-up actions, and business impact such as opportunity progression or attributable profit.
Which Event Marketing KPIs Should You Track?
Track only the KPIs connected to the event objective and decisions. A practical set may include registration conversion, registrations by source, attendance rate, participation rate, survey results, follow-up action rate, sales-accepted handoffs, opportunity progression, cost per attendee, and ROI when the attribution and profit data are defensible.
How Do You Calculate Event Attendance Rate?
Divide unique live attendees by valid registrants and multiply by 100. Define what counts as a valid registrant and a live attendee before reporting. Keep live attendance separate from replay viewing, and compare the rate by audience source or segment when the sample is large enough to be useful.
What Is the Difference between Event Outputs and Outcomes?
Outputs are the immediate things the campaign produced, such as invitations, page visits, registrations, and attendees. Outcomes are changes that follow, such as improved understanding, a completed follow-up action, a qualified sales conversation, product adoption, or another behavior connected to the event objective.
How Do You Measure Event ROI?
Event ROI should use attributable net profit divided by the event investment, multiplied by 100. Use it only when the organization can defend which profit is attributable to the event and which costs are included. Pipeline influenced, meetings booked, or engagement are useful measures, but they are not automatically ROI.
How Should Event Engagement Be Measured?
Define the interaction before calculating it. A participation rate might count unique attendees who asked a question, answered a poll, or completed another meaningful action divided by live attendees. Avoid combining unrelated activities into an unexplained engagement score that cannot be interpreted or compared.
Are Post-Event Survey Results Representative?
Not automatically. Event surveys often reflect the people who chose to respond. Report the number invited, number responding, response rate, question wording, and important audience differences. A high response rate alone does not prove that the responses are free from bias.
How Do You Connect Event Data to Pipeline and Revenue?
Use stable contact and account identifiers, consistent source naming, clear handoff rules, and a documented attribution method across the event platform, web analytics, marketing automation, and CRM. Report observed event facts separately from modeled influence or attributed revenue so the level of certainty remains clear.
Sources and Further Reading
- AMEC Integrated Evaluation Framework: Planning and Measurement: Objectives, outputs, audience responses, outcomes, impact, and planning measurement before activity (opens in a new tab)
- Marketing Accountability Standards Board: Sponsorship Accountability, Measurement: ROI definition, attribution caution, financial contribution, and alignment to stated objectives (opens in a new tab)
- AAPOR: Response Rates - An Overview: Standardized response-rate calculation and the limits of using response rate alone as a survey-quality indicator (opens in a new tab)
- Google Analytics Help: Traffic-Source Dimensions and Manual Tagging: Manual UTM source, medium, campaign, term, content, and source-platform dimensions (opens in a new tab)
- Cvent: 2026 Event-Led Growth Report: Vendor survey of more than 1,000 US and UK marketers on event measurement, pipeline, revenue pressure, and event-led growth (opens in a new tab)